I’m building an ASX portfolio tracker using AI and a bunch of Python tools. It’s been an interesting project to learn these tools. Here’s what I did.
Link for the free open source ASX portfolio tracker: https://asx-portfolio-tracker.streamlit.app/

Why I’m building this thing
I live in Australia and want to track my ASX investments. Sure, CommBank’s app shows my portfolio, but I wanted something more customised – my own dashboard that shows exactly what I care about. So I decided to build it myself.
The toolkit I’m using
Here’s what’s in my tech stack:
- Claude AI: My coding assistant that helps write and debug Python code
- Python: The programming language that ties everything together
- Streamlit: Creates interactive web apps with minimal effort – perfect for dashboards
- Pandas: Handles all the number crunching and data manipulation
- yfinance: Pulls live stock data from Yahoo Finance
- Plotly: Creates those nice interactive charts
- NumPy: Helps with mathematical calculations
Building the app
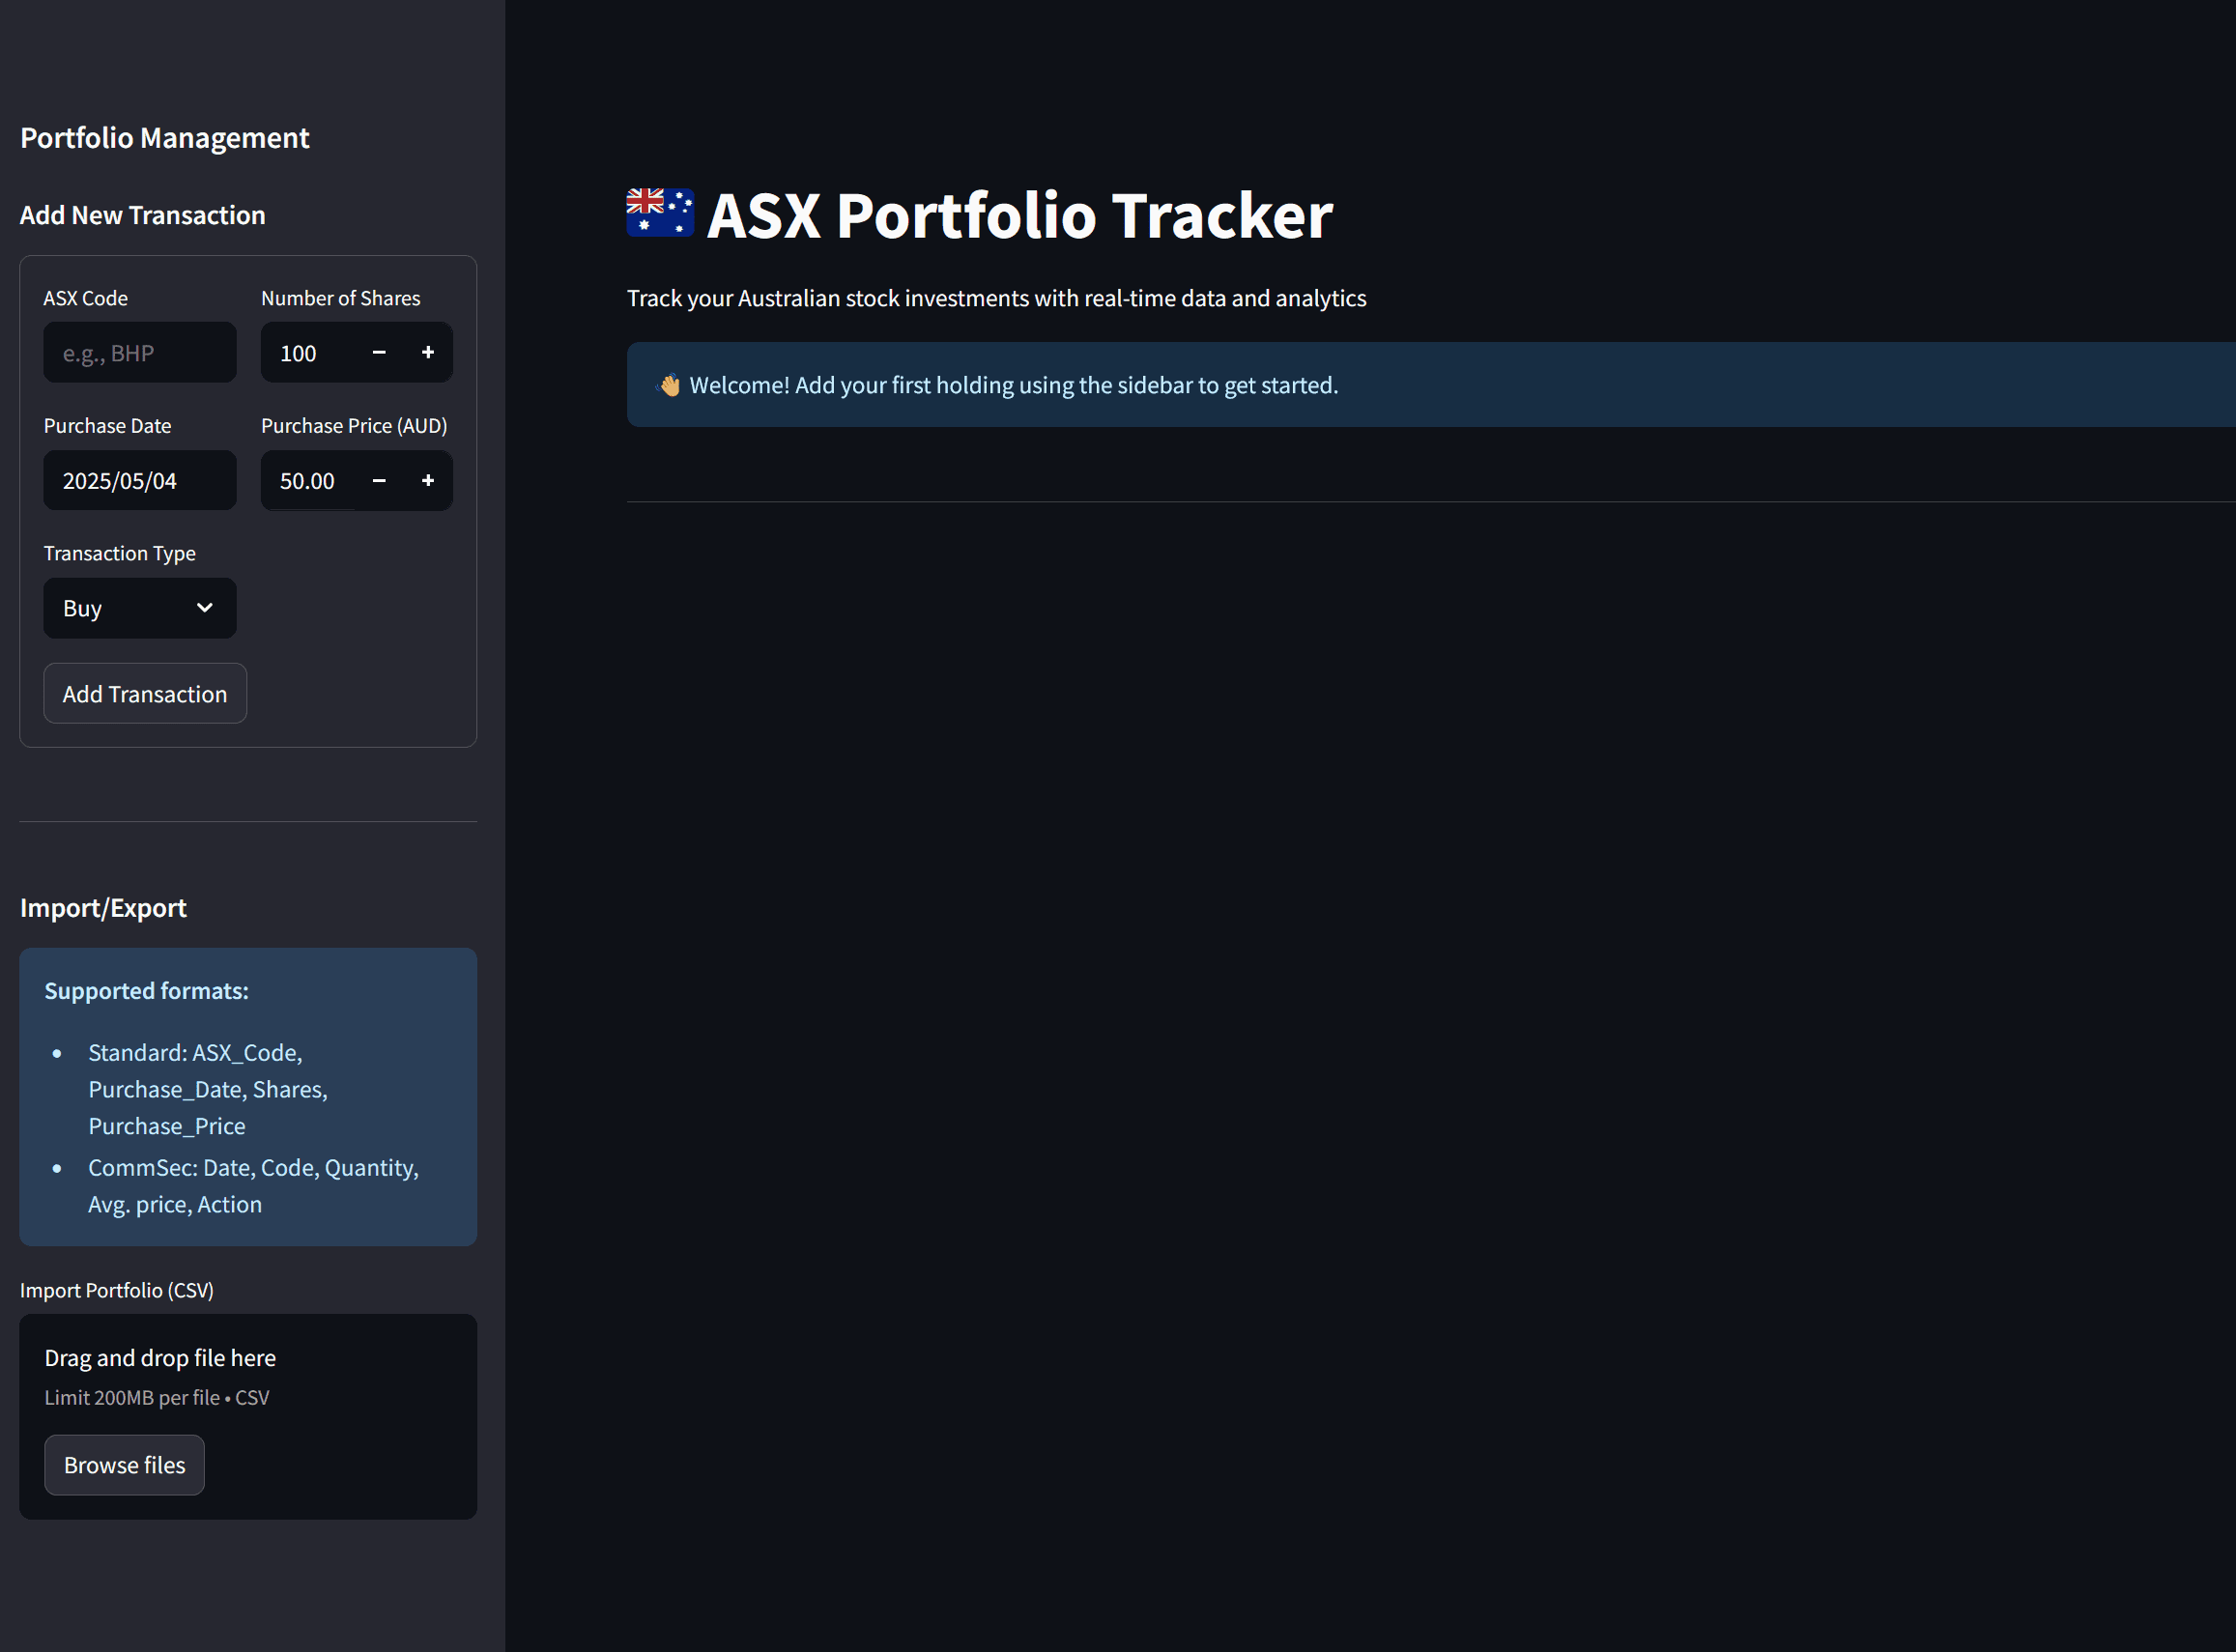
First, I needed to figure out what I wanted this app to do. Nothing fancy – just:
- Import my portfolio data
- Show current values
- Calculate returns
- Display some charts
I exported my trading history from CommBank as a CSV file. With Claude’s help, I started writing code to process this data. The plan was simple: import the file, fetch current prices, calculate returns, and display everything nicely.
The reality check
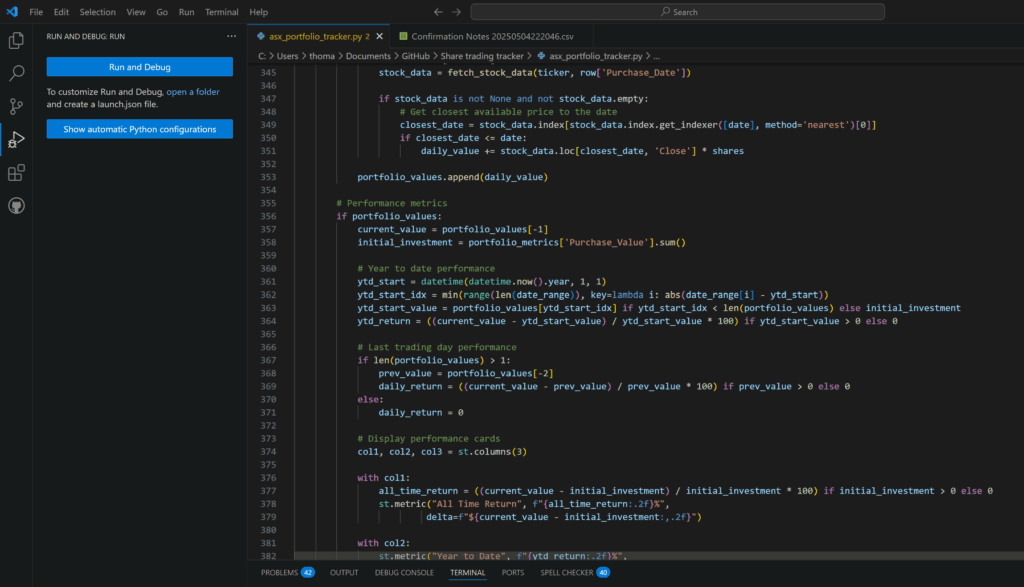
Two hours of debugging. Here’s the chaos I dealt with:
First came the setup problems. Streamlit wouldn’t run properly. Then missing dependencies – spent time installing pandas, yfinance, plotly, numpy one by one as errors popped up.
Then CSV import issues. CommSec’s format didn’t match what I’d coded for. My columns were “Date, Code, Quantity, Avg. price, Action” but the app expected “ASX_Code, Purchase_Date, Shares, Purchase_Price”.
The app was treating all transactions as “Buy” orders. My sells weren’t being processed properly. Added Transaction_Type column and proper buy/sell logic.
UI was a mess too. Tabs were unreadable, column sorting didn’t work, and performance metrics were missing. Fixed it by adding CSS styling, performance scorecards, and color-coded transaction types.
Then came the data loading hang. Yahoo Finance API was timing out, some tickers had the wrong format, and a few stocks were delisted. Added progress indicators, better error handling, and standardised all tickers to .AX format.
What’s missing so far
The tracker works, but it’s basic. Here’s what it doesn’t do yet:
- Dividends: Completely ignored right now
- Franking credits: Not even touched
- Dividend Reinvestment Plans (DRP): Too complex for version one
These limitations mean my return calculations aren’t completely accurate. But hey, it’s a start.
Next steps
I’ll probably add dividend tracking next. Maybe pull that data from somewhere. DRP calculations will be trickier – might need to think about that one.
For now, I’ve got a working dashboard that shows my portfolio performance. It’s not perfect, but I built it myself (with AI help), and it does what I need.
Sometimes that’s all you need – something that works for you, even if it’s not complete.
Leave a Reply